
This post was originally published at a4ai.org.
How does a country’s geography impact its internet costs? This year’s Affordability Report explored this theme, detailing the additional costs that different country types face when building and deploying internet infrastructure. Our research explored the different costs incurred by industry — and ultimately consumers — across (1) coastal, (2) landlocked, (3) island, and (4) archipelago nations. Here’s a snapshot comparison of how different countries are facing the challenge of providing affordable internet access for everyone.
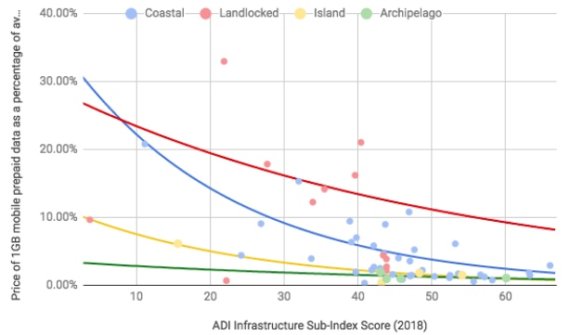
The chart above compares low- and middle-income countries on the affordability of data and on their score on the infrastructure sub-index of the latest edition of the ADI (Affordability Drivers Index). The trendlines – and their differences – offer some insights towards affordable data:
Landlocked countries face the greatest disadvantages in making data affordable, but it’s possible.
Most noticeable on the comparison between countries of different geographies is the inflated barrier for landlocked countries, measured by the red trendline. Even when at comparable or better scores for infrastructure, landlocked countries tend to have higher data costs. Of the landlocked countries in the Affordability Report, only one meets the ‘1 for 2’ affordability target: Kazakhstan. On the other hand, many landlocked countries – Mali and Zimbabwe, for example – have some of the least affordable costs. On top of these challenges to affordable data, landlocked countries tend to have some of the lowest average incomes of any country type, making the real cost to connect for people living there even higher.
Island nations benefit from smaller surface areas and higher population densities.
The eight island and archipelago countries in the Affordability Report average surface areas less than half of continental countries (whether coastal or landlocked) and double the average population density. As a result, this isolates many of the connectivity costs in the high-capacity submarine cables that connect these islands, as detailed in this year’s Affordability Report. In turn, archipelago countries have a higher median price for 1GB of mobile broadband (US$7.25 in December 2017) than island ($5.53), coastal ($6.51), or landlocked countries ($7.16). Many of these countries, however, also benefit from having higher average incomes, balancing the end cost to users as a percentage of their expenses. All but one of these eight countries, Haiti, have data costs under 2% of monthly average income. While archipelago nations often benefit from smaller surface area, the need to connect numerous islands and populations increases the cost to connect.
Geography has a measurable impact on the relationship between network infrastructure and affordable data. While some countries may face challenges or disadvantages from the get-go, locally tailored policies can help make affordable access a reality for any geographic context. Policymakers can and should mix different strategies, such as infrastructure and cost sharing, to maximise investment impact in bringing the largest number of people online.
Read the Affordability Report in full at a4ai.org.
For more updates, follow us on Twitter at @webfoundation and @A4A_Internet and sign up to receive our newsletter.
To receive a weekly news brief on the most important stories in tech, subscribe to The Web This Week.